My AstroImaging Planner

I’d like to share an app that I’ve made that helps with planning a sequence through the night. I’ve seen many great apps that show the altitude of an object throughout night where you can check when your potential target gets too low. However, I haven’t seen one that combines all the targets on your list to give better context about when you might want to switch between the two. Prior to writing this, I’d constantly toggle between different targets in SkySafari or even Telescopius to get the altitude of my potential targets at a certain time.

Instead, I created a web-app that runs locally and pulls in all the targets from Voyager’s Roboclip database and displays their altitude over the course of a night. It includes the Moon’s position as well so you can plan narrowband vs. LRGB imaging around it. Here’s a view of it:

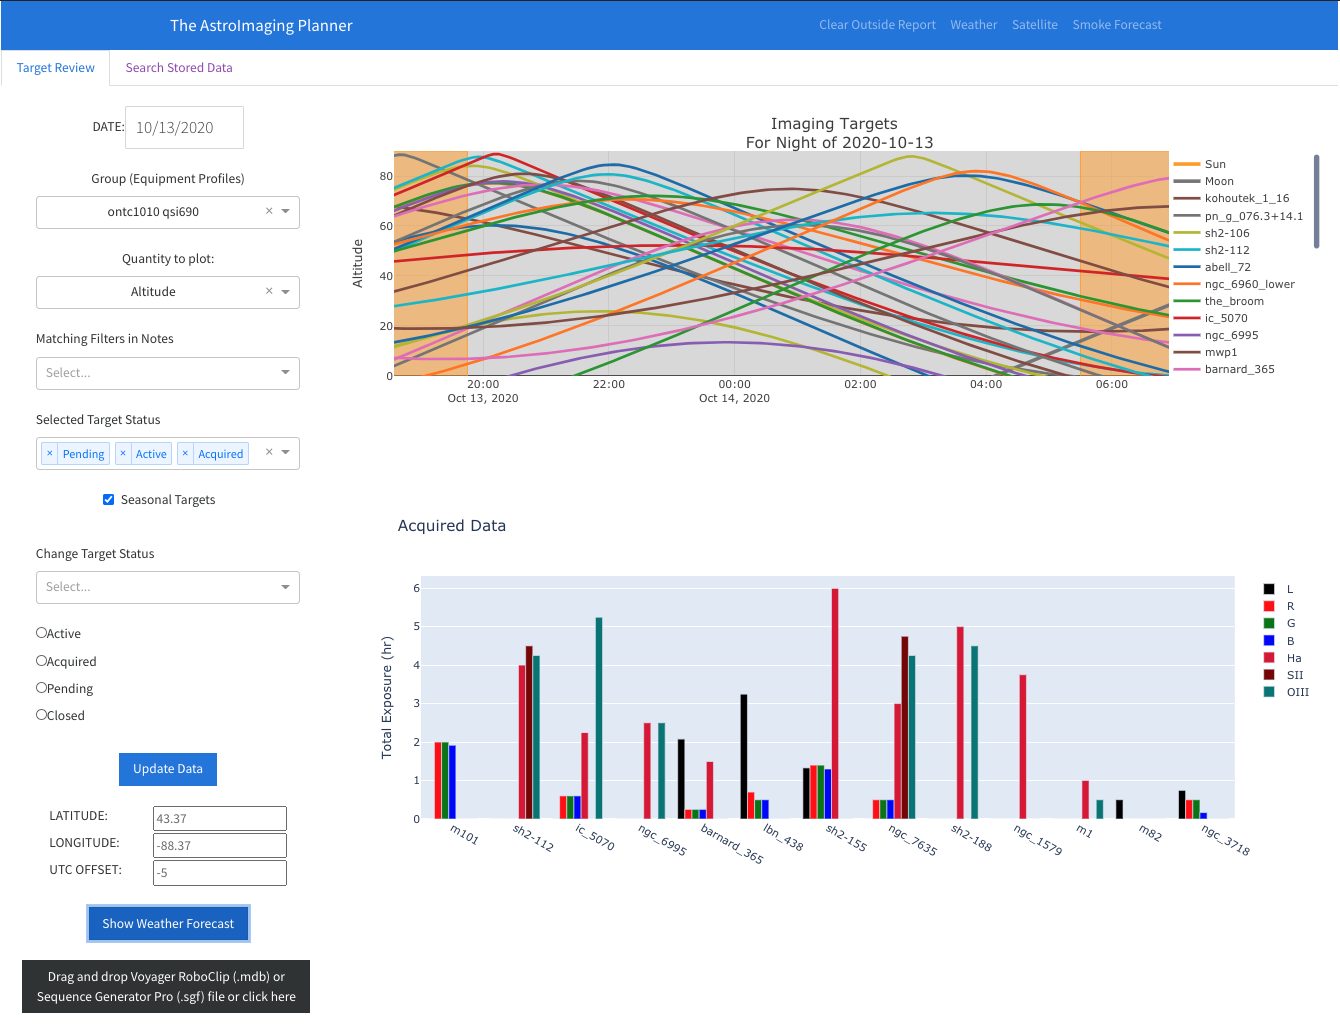
The top chart shows the altitude of each target (and the Moon) over the course of the night, with astronomical dawn/dusk marked by the orange bands. Each curve can be easily hidden. I usually switch from one target to another when their altitude lines cross to keep getting good quality data. All this is calculated on the fly. I have the RA/DEC for each target, and with the geo-location and time, I can calculate the Alt/Az with some python modules. The bottom chart is a summary of data collected so far.

On the left are settings to change the date in case you are planning weeks, etc. in advance of a trip. There’s a dropdown for selecting the equipment profiles, which I have used the Group field in the RoboClip database. There are also dropdown to select targets by matching filters that I stored in the notes section of the roboclip entry.

I’ve also added an option of tracking the target’s status as well. Right now, I just have four:
* Pending - targets I want to image, but haven’t started yet
* Active - this target is actively being imaged this season
* Acquired - this is when I think I have enough data to start processing it
* Closed - I’ve processed and shared this target
These status fields can be filtered as well for the two charts on the right.

There’s also various weather tools like the local forecast using clearoutside, NWS, and GOES satellite links and more relevant lately - a smoke forecast.

The weather here is pretty unpredictable, so this has really helped me coordinate and streamline efforts across 2-3 rigs I setup every night.

I also have another tab which shows the targets with gear I want to use to capture it, the target status (pending/active/acquired/closed), and the exposure summaries. Here’s a view of that:

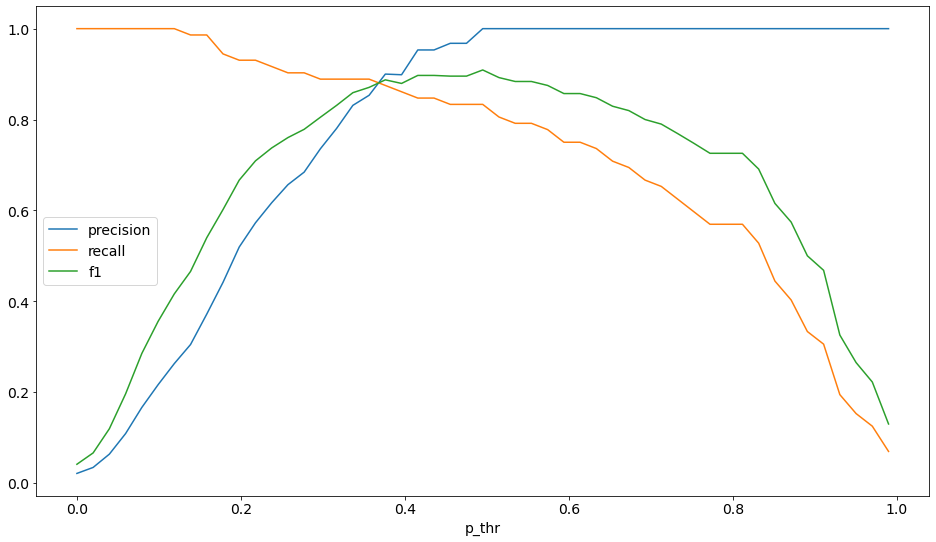
I also have in development a contrast view, which takes into account the bandwidth of filters and the SNR with certain levels of LP, whether it be artificial light from the city, or natural light from the Moon. This also can be extended to include the effect of aerosols in the atmosphere like the smoke we’ve been getting over much of the US this year.

My plan is to eventually open source this project so if others want to contribute, they can. For me right now, it’s a pet project, and one that’s helped me keep my sessions straight. With this, I’ve managed to image a lot more this year compared to prior years with 2x more total exposure than my previous best year.

If you have any questions/comments/suggestions, let me know!

Gabe

16 Likes

Wow Gabe … this is a fantastic tools … I wrote to you in PM about.
Which platform have you used for manage the webapp ?

Congratulations and thanks for sharing.
Leonardo

1 Like

Thank you @Voyager and @PirateMike. It’s been a labor of love getting this into a workable form.

For this dashboard, I’m using Dash, which is a framework developed by the folks from plotly. I work in data science, so it’s popular in that area for constructing dashboard apps without too much headache. I’m not a software developer by trade, so don’t have the bandwidth to hash something out with more flexible means like react. Under the hood of Dash is react, plotly and flask.

I currently have it on github as a private repo, and there are a few other things I was working on when I pivoted to tracking target progress. One I was interested in implementing was having goals for a target, and automatically writing or adjusting a Voyager sequence to try to meet those goals within the time allowed by any given night. However, I decided to put that off for now as I assume that’d be a replication of what’s coming in Voyager Advanced.

My goal was to have it released as a docker image so it can run on any system (Windows, Mac, Linux) with docker installed. I have it installed on my Mac in my home office, and it points to the Roboclip database that I have synced to a dropbox folder. Each of my imaging systems have the same dropbox folder synced, so I have a cron (using ubuntu under windows) to sync the Roboclip database from its native location to the dropbox. That way, when I add a new target using the Voyager Web Server, it syncs to the rest of my systems in a minute. The dash app sees this change and updates the plots, etc. on refresh. One could also just run it on the acquisition machine, but I haven’t tested it that way as it’d be more cumbersome for my workflow.

I also have it pointing to my data directory to parse all the files and monitor new ones as they come in. My goal here was to start with a monitor for progress, which is implemented now. Later, I plan to add an automatic grading system where the sky background, star count, FWHM, ellipticity, sky gradients, SNR, etc. are all quantified and saved to a database. I was thinking about implementing a machine learning approach to flagging anomalous frames in case there were clouds interrupting the image, or an airplane flew through the image. That way, the progress bars can be updated with an all data/clean data view.

Gabe

2 Likes

Gabe,

That is some fantastic work!

Last night, I started writing a program that would let me know about my targets based on my custom horizon. Seeing what you’ve put together, I’ve got enough other projects on my plate; I’ll focus on those first and wait for this to be released instead.

Great work!

2 Likes

That is indeed really excellent work ! I’ve always juggled with targets and conditions trying to get the best out of my filters. Fortunately the British weather makes selection of filter really easy - most if the time it doesn’t matter :cloud_with_rain:

Will keep my eye on developments. Dash also sounds really interesting, might have a delve myself.

Thanks for sharing

Robert

1 Like

Excellent tool Gabe, this is a great work!
Very useful, hope to try it soon.
Francesco

1 Like

Wohaaaa !!! this is a realy interesting piece of software. I’m drooling on my keyboard loking at your two screenshots. I’m looking foward to try it.

Martin

1 Like

Drooling in anticipation. Thanks Gabe!

1 Like

I’m seriously considering adding the auto-grading of images to this app.

Some experimentation has shown that I’m finding images with this autograder that should be tossed out that I had previously known about, but forgot to tag in my identification of bad subs. These are from situations like bad collimation, wind impacting mount tracking, dew formation, and clouds.

I built a classifier model for autograding that’s trained on extracted properties of images. I have about 3900 images on hand, with about 60 that were tagged as bad images. It took about 10 minutes to process all those images and extract the image features I used for training.

The model, led me to identify about 30 other images that should’ve been tagged as bad. I inspected them, and sure enough there were issues with them, ranging from tracking errors from wind, bad collimation and dew issues.

Typically, accuracy would be the metric that sounds most important for a classifier like this. However, there’s a large imbalance of accepted to rejected subs (around 40:1). The most important metrics to track whether the model is doing a good job instead are precision and recall. If you value low false negative rates (like in the case of a test for something like cancer), you’d want the recall rate to be high. Likewise, if you want the false positive rate to be low, you want high precision.

Precision = True Positive / ( True Positive + False Positive)
Recall = True Positive / ( True Positive + False Negative)

In the end, I found a model that has high precision and recall

Here are these metrics as you vary the probability of rejection:

I’m thinking of having another tab for this app to drill down to the subs level, where you can see this probability of rejection, have a preview of the file, and allow you to change its status to rejected/accepted. I’m sure I could also have a retrain ability as well to further improve the model to learn about your typical skies, and what you’re comfortable accpeting/rejecting subs.

Here’s an example of a sub that the model found as ok (probability score of 14%):

Here’s one if found that should be rejected with a probability score of 74%:

Here’s one that I hadn’t identified earlier, but was a result of bad collimation to start the night (p-score = 75%):

Here’s one where dew started spoiling the night (p-score = 92%):

Gabe,

Are we somehow able to use this ourselves?

1 Like

Thanks everyone for all the feedback!

I’d say the planner would be available first. I’m hoping to have it cleaned up and public in the next few weeks. The auto-grading is a side project that I’m probably going to add to this down the road.

2 Likes

The horizon should be easy to implement in the app. I think just reading a config file w/ alt/az entries and showing on the target altitude plot when they clear the horizon would work.

1 Like

Thanks Gabe, this is a cool project.

1 Like

That would be fantastic and would make it compatible with many software programmes that read out from such a file (as well as APCC from Astro-Physics for example).

Roberto

1 Like

Here’s that implementation. I’m extending the “below horizon” lines w/ a thinner and more transparent line. I’m reading directly from a .hrz file exported by APCC. The format is [az, alt] pairs per line.

Custom horizon from APCC:
Screen Shot 2020-10-19 at 5.36.30 PM

2 Likes

This looks too sweet and I can’t wait to see a public version! Nice work Gabe!

1 Like

Fantastic work @AstroGabe !
Lots of great ideas
I’ve playing around with python and the Astropy library to make a grading FITS grading tool with no success so far. I’d be interested in how far you get with it
cheers

Nick

1 Like

Gabe, this is excellent! I am looking forward to use this tool whenever you decide to share it. I am doing something similar but with a bunch of crappy scripts, goole sheets and telescopius, nothing close to what you have achieved.

Congrats,

José

1 Like

I’m getting very close to releasing it. I added the docker image to docker hub, so it’ll be easier to get up and running. The image size is about 1GB. Otherwise, you could build it from scratch, but that takes some time to do.

Gabe

3 Likes